Over the past few years, organizations have made massive investments in modern data platforms. Databricks, in particular, has become the platform of choice for powering data unification, analytics, and AI solutions across various industries, including manufacturing, healthcare, retail, and financial services.
But here’s the uncomfortable truth:
Technology alone does not deliver ROI. Value is created when organizations operationalize the platform, align it to business outcomes, and implement a measurement framework that continuously accrues value.
This is where most data programs struggle.
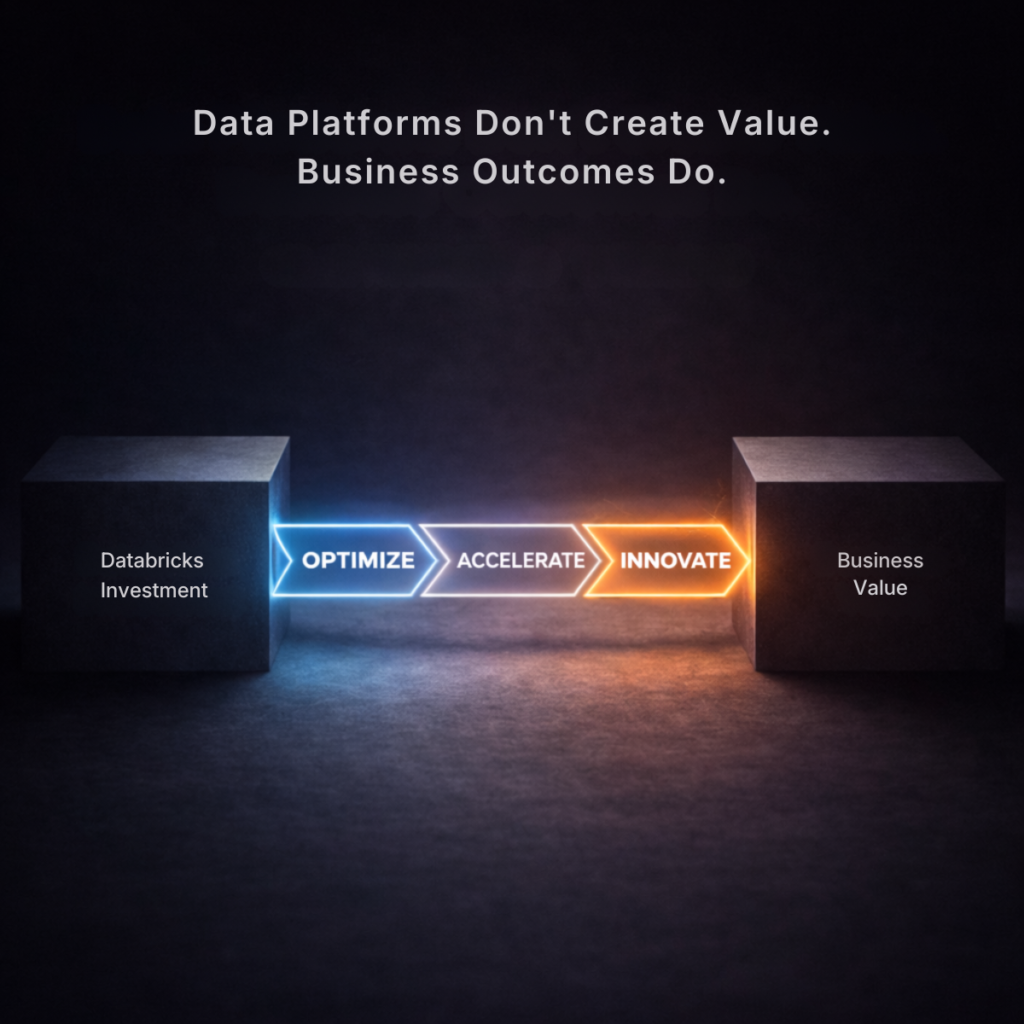
Drawing from multiple data modernization programs, I’ve observed that organizations unlock the most value by following a simple three-stage Databricks framework:
Optimize for stability and cost efficiency → Accelerate for insight velocity → Innovate for AI-led transformation.
Below is a practical, real-world breakdown of what ROI looks like at each stage.
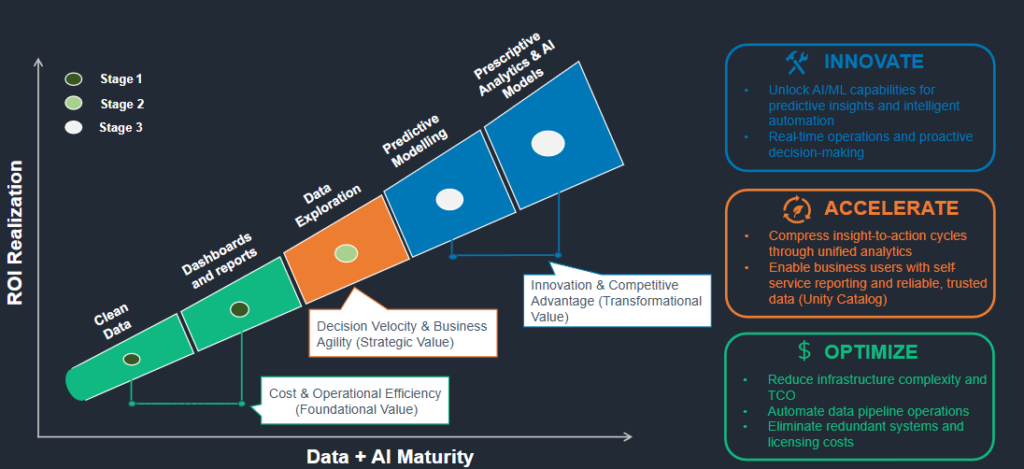
3-Stage ROI Framework
Stage 1: OPTIMIZE – Cost Reduction & Data Foundation
Most journeys begin here.
Organizations consolidate data residing in fragmented systems, automate data pipelines, and replace legacy SQL servers, SSIS/SSAS workloads, and manual processes.
This stage answers:
“How do we reduce cost, simplify the data asset landscape, and build a trustworthy foundation?”
Typical ROI drivers:
- Infrastructure rationalization (cloud elasticity, pay-per-use savings)
- Decommissioning high-cost on-prem servers and legacy ETL tools
- Automated data quality checks and self-healing pipelines
- Improved IT productivity through standardization
Why it matters:
Without this unified, governed foundation, all subsequent analytics and AI efforts will fail or remain stuck in pilot purgatory.
This stage creates the foundation and platform that delivers speed and intelligence later.
Stage 2: ACCELERATE – Improve Insight-to-Action Speed
Once data is unified and reliable, organizations unlock the next layer of ROI:
‘Speed’.
This stage answers:
“How do we help the business make faster, better decisions?”
With Databricks SQL, Power BI/Tableau connectors, Unity Catalog, and real-time pipelines in place, teams can finally access consistent, trustworthy insights.
Typical ROI drivers:
- Real-time dashboards for operations, supply chain, finance, and field teams
- Democratization of insights with reduction in reporting cycles(hours → minutes/hours)
- Improved decisions through instant access to governed datasets
- Automated alerts for anomalies, delays, or business risks
Why it matters:
Insight velocity is the new competitive advantage.
Executives, operations managers, and frontline teams move from reacting to anticipating market or operational shifts.
Stage 3: Innovate – Predictive Insights & AI-Led Innovation
This is the Transformation – crucially, this layer is only accessible when the foundation of Stage 1 and the speed of Stage 2 are mature.
This stage answers:
“How do we move beyond insights and use AI to reinvent processes, products, and opportunities?”
With AI Agents, MLflow, Feature Store, Delta Live Tables, and the Lakehouse architecture, organizations start building predictive and intelligent capabilities.
Typical ROI drivers:
- Predictive demand planning and inventory optimization
- Forecasting models for cash flow, churn, quality, and warranty claims
- Accelerated Time-to-Value for GenAI and Agentic AI adoption
- Faster product innovation enabled by unified data and ML workflows
- Self-Service analysis for business using AI Agents
Why it matters:
AI becomes operational, not experimental.
Organizations reduce uncertainty, anticipate shifting business landscapes, and scale their competitive advantage.
How to Measure Databricks ROI – A Practical Approach
Here’s a simple, repeatable framework I use with clients:
1. Baseline the Current State
Capture:
- Data engineering effort
- Reporting cycle times
- Infrastructure spends
- Business process bottlenecks
2. Map Business Value to P&L
For each use case, quantify impact on:
- Cost of Goods Sold (COGS)
- Working capital
- Revenue
- SG&A
- Earnings
- Productivity
3. Track Improvements Rigorously & Quarterly
Examples:
Optimize Metrics (Foundation & Cost Efficiency)
- % reduction in pipeline failures & data quality issues
- $ savings from infrastructure and system consolidation
Accelerate Metrics (Decision Velocity & Agility)
- Avg. Time to Decision (TTD) improvement across functions
- % reduction in manual reporting effort/turnaround time
Innovate Metrics (AI-Enabled Value & Transformation)
- % defect reduction or yield improvement from predictive models
- Forecast accuracy improvements (demand, inventory, warranty, etc.)
Databricks ROI is not theoretical – it becomes visible when tracked consistently.
Final Thought: The Value is in the Journey
The Databricks ROI curve is not a technology roadmap.
It’s a business value roadmap.
Organizations that get it right treat Databricks as:
- a foundation for data reliability (Optimize),
- a driver of decision speed (Accelerate), and
- an engine for AI-led innovation (Innovate).
Those that get stuck usually skip steps or chase AI without fixing data fundamentals.
The companies winning today are the ones that approach Databricks strategically – not as another IT platform, but as a value creation system.